
How To Use top, netstat, du, & Other Tools to Monitor Server Resources

As a server administrator, it’s crucial to monitor server resources regularly to ensure that everything is running smoothly. Proactive monitoring allows you to identify potential bottlenecks, troubleshoot performance issues, and prevent server downtime. In this article, we’ll cover some of the essential tools that you can use to monitor server resources and explore alternative solutions for resource monitoring. Effective use of tools like top, netstat, and du is vital for maintaining a healthy server environment.
Core Tools for Server Resource Monitoring
Let’s explore the fundamental tools initially discussed for server resource monitoring:
Top
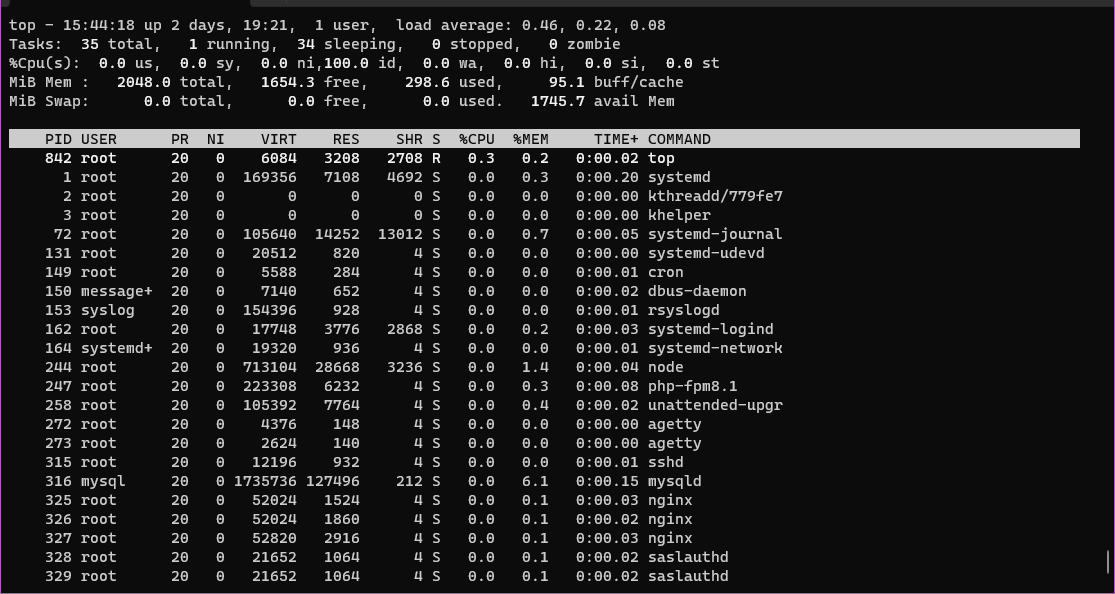
Top is a command-line tool that provides real-time information about the system’s processes, including CPU usage, memory usage, and system load. It’s an indispensable tool for getting a quick overview of server performance. To use top, open your terminal and type:
$ topYou can use the following keys to interact with top:
h: Display help information.q: Quit thetopprogram.k: Kill a process.m: Toggle memory information display.c: Toggle display of command line vs. program name.
Netstat
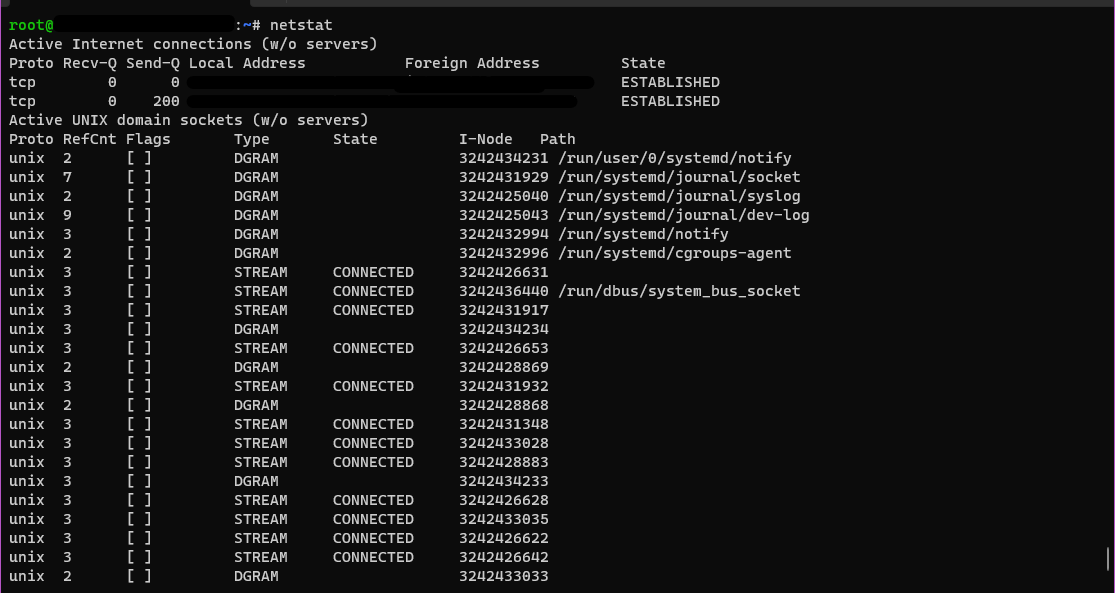
Netstat is a command-line tool that displays network connections, routing tables, and network interface statistics. This is useful for identifying open ports, established connections, and potential network issues. To use netstat, open your terminal and type:
$ netstat -aThis command will show all the network connections that are active on your system.
You can use the following keys to interact with netstat:
-a: Show all connections, listening and non-listening.-t: Show TCP connections.-u: Show UDP connections.-l: Show listening server sockets.-p: Show the PID and name of the program to which each socket belongs.-n: Show numerical addresses instead of trying to determine symbolic host names.
Du
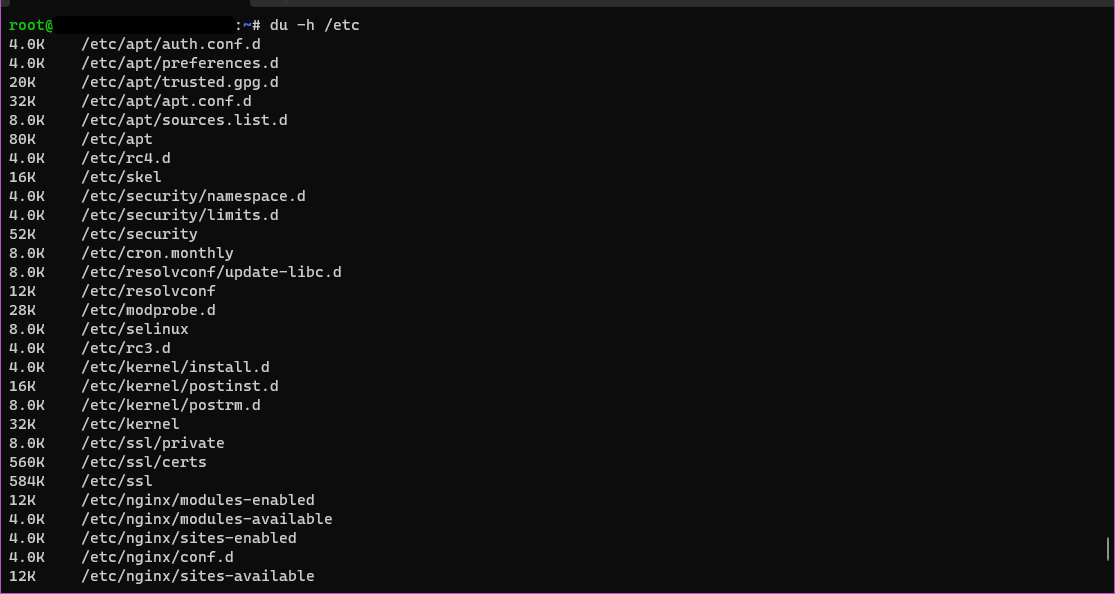
Du is a command-line tool that displays disk usage statistics for a file or directory. Monitoring disk usage helps prevent your server from running out of space. To use du, open your terminal and type:
$ du -h /path/to/directoryThis command will display the disk usage of the specified directory in a human-readable format.
You can use the following keys to interact with du:
-h: Display sizes in human-readable format (e.g., 1K, 234M, 2G).-s: Display only a total for each argument.-c: Produce a grand total.-a: Display an entry for each file in a directory.
Htop
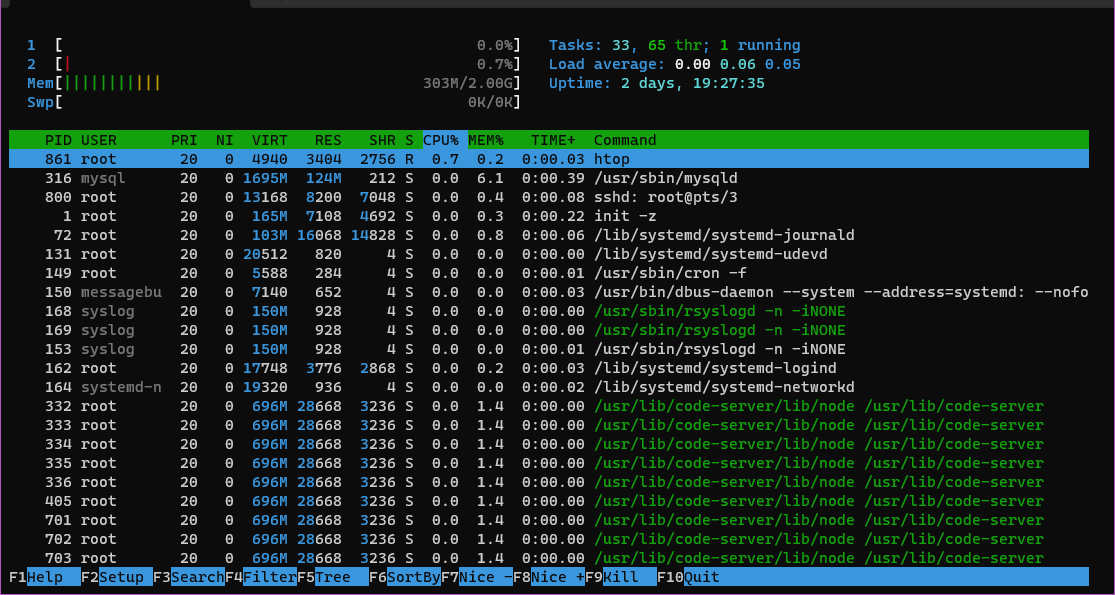
Htop is an interactive process viewer and system monitor that provides a more user-friendly interface than top. It offers a colored output and allows you to easily scroll through processes. To use htop, open your terminal and type:
$ htopYou can use the following keys to interact with htop:
F1or?: Help.F2orS: Setup.F3or/: Search for a process.F9: Kill a process.q: Quit.
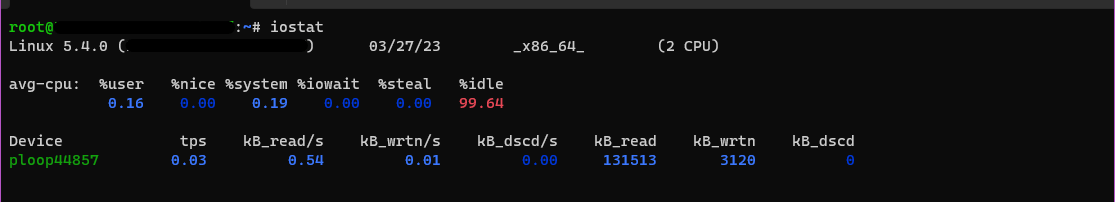
Iostat
Iostat is a command-line tool that displays CPU utilization and I/O statistics. This is helpful for identifying disk I/O bottlenecks. To use iostat, open your terminal and type:
$ iostatYou can use the following keys to interact with iostat:
iostat -c: Display CPU utilization report.iostat -d: Display disk utilization report.iostat -x: Display extended disk statistics.
Net-tools
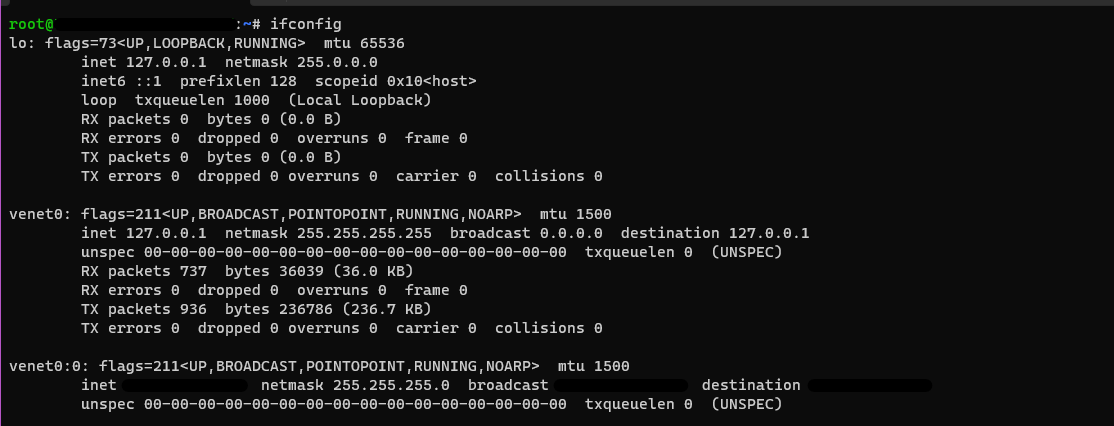
Net-tools is a collection of command-line tools that provides information about network connections and interfaces. Although largely superseded by iproute2, it still contains useful tools like ifconfig. To use net-tools, open your terminal and type:
$ ifconfigThis command will show information about all network interfaces on your system.
You can use the following keys to interact with net-tools:
ifconfig eth0: Display information for theeth0interface.ifconfig eth0 up: Bring theeth0interface up.ifconfig eth0 down: Bring theeth0interface down.
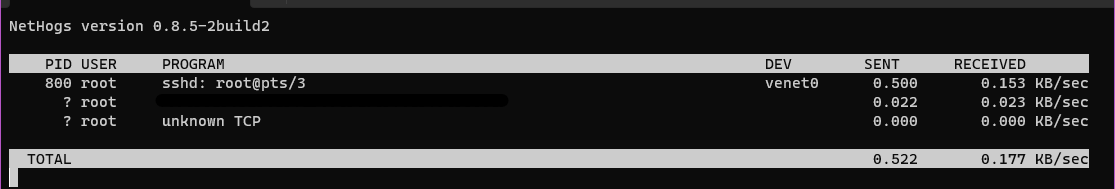
Nethogs
If your network connection seems overutilized and you are unsure which application is the culprit, a program called nethogs is a good choice for finding out.
Nethogs is a command-line tool that provides real-time network bandwidth monitoring.
On Ubuntu, you can install nethogs with the following command:
$ sudo apt install nethogsTo use nethogs, open your terminal and type:
$ sudo nethogsThis command will show the network bandwidth usage of each process on your system.
You can use the following keys to interact with nethogs:
q: Quit the program.m: Toggle between total, KB/s, and KB mode.r: Sort by receive.s: Sort by send.
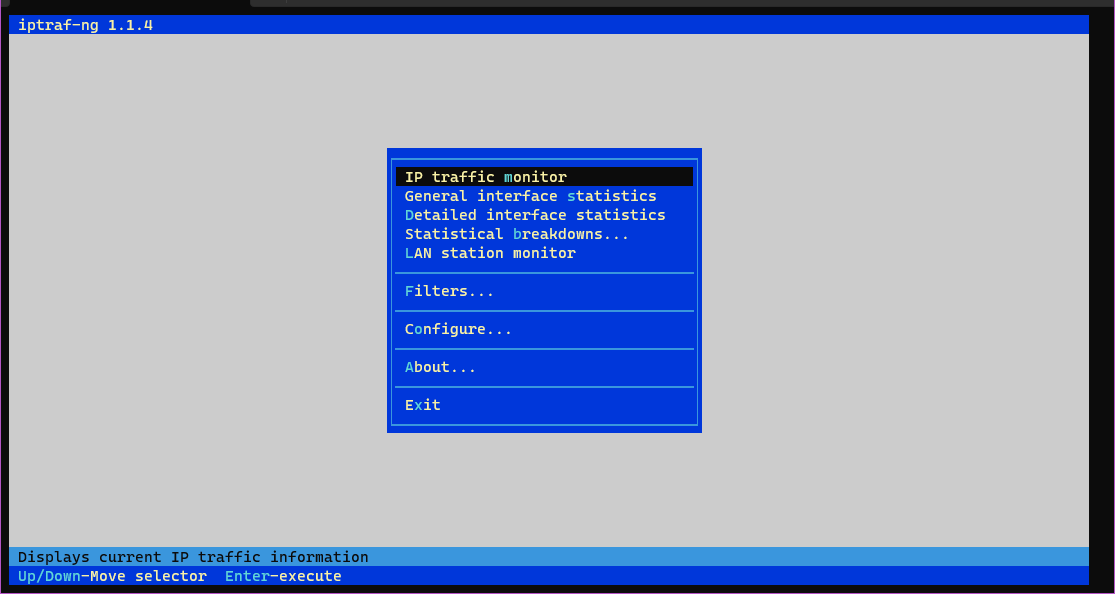
Iptraf-ng
Iptraf-ng is a command-line tool that provides real-time network statistics for each network interface on your system.
you can install iptraf-ng with the following command:
$ sudo apt install iptraf-ngTo use iptraf-ng, open your terminal and type:
$ sudo iptraf-ngThis command will show real-time statistics for each network interface.
You can use the following keys to interact with iptraf-ng:
- Navigate the menus using the arrow keys, and select options using Enter. The interface is menu driven.
Alternative Solutions for Server Resource Monitoring
While the command-line tools mentioned above are powerful and readily available, they might not be ideal for long-term monitoring or providing a comprehensive overview of server health. Here are two alternative approaches to monitoring server resources:
1. Using a Centralized Monitoring Solution (e.g., Prometheus and Grafana)
Explanation:
Prometheus is an open-source systems monitoring and alerting toolkit. It collects metrics from your servers at specified intervals, stores them, and provides a query language (PromQL) to analyze the data. Grafana is an open-source data visualization and monitoring suite that can connect to Prometheus (and other data sources) to create dashboards and visualizations.
This combination provides a centralized and scalable monitoring solution. Instead of manually running commands on each server, you can have a single dashboard showing the CPU usage, memory usage, disk space, network traffic, and other critical metrics for all your servers. Alerts can be configured to notify you when thresholds are exceeded.
Code Example (Illustrative Prometheus Exporter Configuration – Node Exporter):
Prometheus itself doesn’t directly monitor servers. Instead, you need "exporters" that collect metrics and expose them in a format Prometheus understands. The Node Exporter is commonly used to collect system metrics on Linux servers.
First, download and install the Node Exporter on your server:
wget https://github.com/prometheus/node_exporter/releases/download/v1.3.1/node_exporter-1.3.1.linux-amd64.tar.gz
tar -xvf node_exporter-1.3.1.linux-amd64.tar.gz
cd node_exporter-1.3.1.linux-amd64
sudo cp node_exporter /usr/local/bin/
Then, run the Node Exporter:
sudo ./node_exporterThis will start the exporter, which will expose metrics on port 9100.
Next, configure Prometheus to scrape metrics from the Node Exporter by adding the following to your prometheus.yml configuration file:
scrape_configs:
  - job_name: 'node'
    static_configs:
      - targets: ['your_server_ip:9100'] # Replace with your server's IP
Finally, restart Prometheus. You can then use Grafana to connect to Prometheus and create dashboards to visualize the collected metrics. Grafana has pre-built dashboards for the Node Exporter.
2. Using a Lightweight Agent-Based Monitoring System (e.g., Glances)
Explanation:
Glances is a cross-platform monitoring tool written in Python. It’s designed to be lightweight and provide a comprehensive overview of system resources in a compact terminal interface. It’s easier to set up than Prometheus/Grafana but less scalable.
Glances offers a balance between the simplicity of command-line tools like top and the complexity of full-fledged monitoring systems. It uses color-coding to highlight critical metrics and can be configured to display a wide range of information, including CPU usage, memory usage, disk I/O, network traffic, and running processes. Glances can also operate in client/server mode, allowing you to monitor remote servers from a central location.
Code Example (Installing and Running Glances):
sudo apt update
sudo apt install glances
After installation, simply run:
glancesTo run glances in server mode:
glances -s -B 0.0.0.0 # Bind to all interfacesThen, from another machine, you can connect to the Glances server using a web browser (default port is 61208): http://your_server_ip:61208. Or, you can install glances on your local machine and connect via the command line:
glances -c your_server_ipThese tools and techniques are invaluable for any server administrator looking to maintain a stable and efficient server environment. Remember that monitoring server resources is not a one-time task; it’s an ongoing process that requires regular attention and adjustments to ensure optimal performance and prevent potential problems. The key to effective server monitoring is understanding your server’s baseline performance, identifying deviations from that baseline, and taking proactive steps to address any issues that arise. Knowing how to use top, netstat, and du and the other tools discussed is a great starting point.